
Tinkering Part 2: Simulating Outcomes
Quantifying impacts of experimentation


There is something irreversible about acquiring knowledge; and the simulation of the search for it differs in a most profound way from the reality.
-J. Robert Oppenheimer
I previously wrote about why it is important to tinker and to have an exploration budget. The gist is that tinkering can expose you to non-linear returns that can result in improvements by orders of magnitude. In order to take advantage of this effect, you should set aside an exploration budget that's a smaller percentage of the total. The question becomes what is the right amount to set aside? This post walks through some simple simulations to show you one method of figuring out the right amount to allocate. Here's a preview plot of what we'll be walking through:

Figure 1: The initial tinkering simulation
Simulation Setup
The goal of our simulation is to determine the overall impact of tinkering and to determine the appropriate budget percentage to allocate to tinkering. We'll be using Monte Carlo methods to evaluate the effects. In simple terms, Monte Carlo methods repeatedly draw from a given distribution. However, the methods are very, very powerful. Now let's dig into how we set up the simulation. Note that this will be a simple way to se tup the simulation and there are various ways you could sharpen your pencil. However, it should give you a good mental model of how to play with the ideas.
To set up our simulation, we want to compare the effects of the growth of a business with and without tinkering. We'll force that each business grows at the same rate (which we will randomly draw from to create artificial business growth). We will set the starting value of the business at 1. This will make it easier to understand the multiple improvement that can be obtained. We'll then simulate 10 years of quarters, or 40 quarters. At this point, we'll have a business that grows (randomly) a little bit each quarter, this will be our business without any tinkering. To add in the effect of tinkering, we will create a budget allocation and a number of experiments to run each quarter. Each experiment will evenly split the available budget in its attempt for success. These tinkering experiments will draw from a power law distribution where the majority of the outcomes will be close to zero, or a loss of our investment. Every so often, a few experiments will result in large returns in our budgeted investment.
With this setup, we can compare the effects of with and without tinkering. We'll be running multiple trials on any given assessment to understand the median effects. We can also explore the parameters that affect behavior. This will allow us to answer such questions as:
What's the optimal exploration budget allocation?
What happens if the exploration budget is set too high?
What happens if I don't run a lot of experiments?
What happens if I don't go for high impact results?
The Effects of Tinkering
Let's take a first pass and see what happens when we run an initial simulation with the following parameters. These will change as we go through the post.
10 experiments per quarter
Exploration budget set at 5%
Average quarterly growth at 3% with a standard deviation of 1%
Successful experiment multiplier of ~15
With this configuration, we can look at the successful experiment multiplier and the power law distribution of payoffs. The percentiles of tinkering payoffs for the configuration above are as follows:
The 50th percentile return of a tinkering experiment is 0.015. Meaning that we lose 98.5% of the budgeted investment. Half of our experiments will lose this amount or more.
The 75th percentile return is 0.54. Meaning that we lose 46% of the budgeted investment. Three quarters of our experiments lose this amount or more.
The 90th percentile return is 3.39. Meaning that we return our initial investment plus 239%. only 10% of our experiments will achieve this level or more. While this is good, remember that we are splitting our experiment budget evenly across all experiments. So, if we do 10 experiments in a quarter, we still aren't making back the full investment with this value.
The 95th percentile return is 7.58. Meaning that we return our initial investment plus 658%. Only 5% of our experimental investments will achieve this amount or more. As for the 90th percentile, this still does not pay back the full portfolio of experiments.
The 99th percentile return is 13.22. Meaning that we return our initial investment plus 1222%. Only 1% of our experimental investments will achieve this amount or more. Finally, at this point we have been able to pay back the initial investment of our portfolio and then some. This is how the power law works, a very small number of outcomes account for a majority of the impact.
What happens when you apply this configuration in our simulation? Let's look at the first simulation. Note that each trial will be very lightly colored while the median value will be bolded. Tinkering values will be in purple and non-tinkering values will be in red.
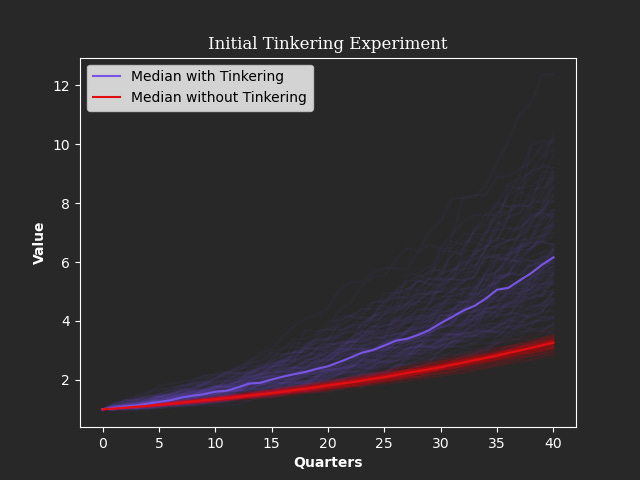
Figure 2: Results from the initial simulation configuration
Interesting! What can we notice? In an average growth scenario, with a moderate amount of high impact tinkering we can about double our return over 40 quarters, on average. There are some trials (lightly colored lines) that can produce up to 4x the return (value of 12 at the very top) but that's only 1% of the cases. On the other side there are also a bunch of trials that barely do better than no tinkering. Overall, tinkering seems worthwhile to pursue.
Well, you say, perhaps the growth is covering up the expense of the exploration budget and that's why. Take a look at the situation where there is no business growth at all.

Figure 3: Impacts of tinkering in a no growth scenario
Perhaps unexpected? Tinkering can still double the impact on average. If you look closely, some of the trials do perform worse than no growth, however that is very few. Between the two median lines, there is not the same level of growth but it still appears better to be tinkering at these parameters than not to.
It's not all sunshine and rainbows though. If we take the view that we should allocate 80% of our budget to experimental tinkering, it means that we should also increase the number of experiments per quarter coupled with a lower expected magnitude of impact. What's the result? You go broke.
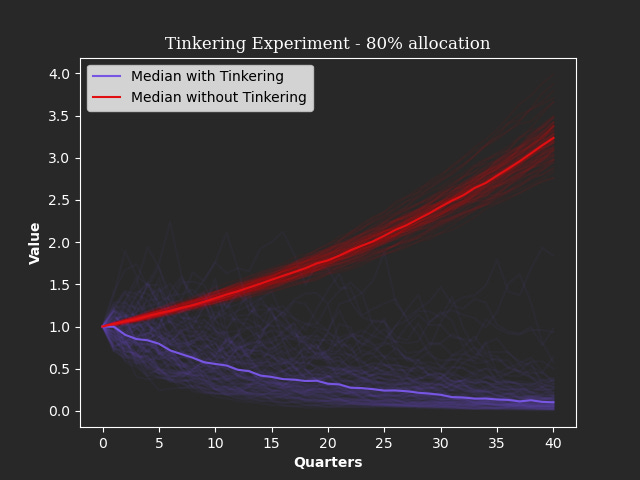
Figure 4: Going broke from excessive tinkering
Examining Parameter Effects
Why do we have to go for big payoffs? Most experimentation ends in failure, it's just part of the process. To account for this, we need each experiment to have a large return to make up for the losses. But that's just to break even on the experimentation. We need to have an even larger return to make the impact worthwhile. Let's see what that looks like. We'll do this by removing any impact of growth that might muddy the results.
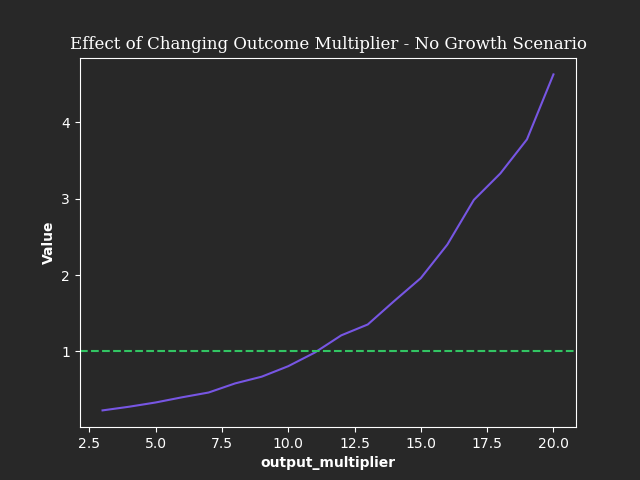
Figure 5: Aggregation of multiple simulations to understand the effects of different upper bound returns of tinkering experiments.
Remember, now we are examining the final value after 40 quarters. Looking at this we need the average impact of our most successful experiments to return about 11x our initial investment just to break even. Note that this is only a single round for each configuration value. If we wanted to refine this result, we would run multiple simulations at each configuration. What about the percentage to allocate to the exploration budget?

Figure 6: Aggregation of multiple simulations to understand the effects of different budget allocation to tinkering experiments for a fixed configuration.
It looks like the maximum payoff might occur somewhere between an allocation of 30-40%. While anything above 60% is doomed to fail. However, remember that this simulation is a bit simplistic and is only examining the effects of allocating budget to certain scenarios. It does not account for the amount that is required to keep your main project/objective/company on the path to success. Saying you are allocating 40% to exploration is equivalent to saying that your company/project/etc can operate with only 60% of its current budget. I highly doubt that is the case in most scenarios. In order to function well you need to apply other types of risk management. Remember, a simulation should be used to guide decision making, not taken as gospel. The results here are shown for a single configuration. Changing the configuration will change the results and potentially the conclusions.
Conclusions
If done right, the effects of non-linear tinkering can be powerful. However, this requires allocating resources to exploring experiments that can result in large payoffs. As we look at the outcomes of this simplistic simulation, there are a few things to note.
Just like knowledge, tinkering compounds over time.
While the majority of outcomes will be failures or partial failures, you need a portfolio of experiments to get great outcomes.
Your experimentation should be swinging for the fences; big outcomes are needed to account for all of the failures that will occur.
Set your exploration budget at the lower end to not put your entire project/portfolio/company at risk. This is akin to employing a barbell strategy.
Simulations still contain plenty of randomness (it is in fact what we are relying on), so you should experiment many times with different configurations to get a full understanding of likely outcomes.
If you enjoyed this and want to play with the simulation yourself, I set up a Google Colab notebook here. Play around with it. Have fun with it. If you have any improvement suggestions, please feel free to reply to this email to share your thoughts.